1. Introduction We are all well aware of the term plastic, but are we really well informed what this plastic is? The answer is no. Plastic is a material consisting of a wide range of synthetic or semi-synthetic organic compounds that are malleable and therefore can be molded into solid objects. Plastics have been adopted in a significant, and ever-expanding, range of products thanks to their relatively low cost, ease of manufacture, versatility, and imperviousness to water. We find plastic in products as simple as paperclips or as complex as planes. Plastic products have become an integral part of our daily life as a basic need. Mostly, plastics are recyclable but recycling it again and again leaves litter that is left over in earth system and water systems and is hazardous to the environment. We can recycle a virgin plastic material many times, but after every recycling, the plastic material is deteriorated due to thermal pressure. Well, we lack this knowledge and continue using plastics as an object of daily use.
1.1Plastic It is a lightweight, hygienic and resistant material which can be molded in a variety of ways and utilized in a wide range of applications. Plastics are the product of coal, natural gas, crude oil, cellulose and salt, manufactured through energy-intensive technology. Most plastics do not biodegrade, but instead they photo degrade, meaning that they slowly break down into small fragments known as micro plastics. Due to wide scale use of plastic, water, soil and air pollutions are caused, that ultimately lead to imbalance of various ecosystem of the Earth.
1.2 Single Use Plastic Single use plastics are disposable plastics meant for use-and-throw. These comprise polythene bags, plastic drinking bottles, plastic bottle caps, food wrappers, plastic sachets, plastic wrappers, straws, stirrers and Styrofoam cups or plates. Some of these items are thrown away merely in minutes but can take thousands of years to decompose, thus contaminating our soil and water in the process. Also the noxious chemicals used to produce plastic get transmitted to animal tissue, and finally, can contaminate food chain.
2. Impact of Single Use Plastic Single use plastics end up littering the environment in part because of irresponsible individual behavior and poor waste management system.
2.1 Environmental Impacts It contaminates soil and water bodies. It also chokes the waterways and exacerbates natural disasters. According to reports, by 2050, an estimated 99% of seabirds will have ingested plastic.
2.2 Health Impacts It blocks sewage systems and provides a breeding ground for mosquitoes, raising the risk of malaria transmission into humans. It also releases toxic chemicals and emissions if burned. It also contaminates the food chain.
2.3 Economic Impacts It causes economic loss in tourism, fishing and shipping industries. High costs are incurred in order to transport lightweight foamed plastics due to difficulty in recycling at local plants. It also accounts for future costs of removal of accumulated plastic litter in the environment.
3. Methodology
3.1 Study Area This study was conducted in different areas within Patna, the capital of Bihar, with the help of questionnaire. The study was conducted to find out the perception of the residents upon use of single use plastic and what impact it has on the environment.
3.2 Data Collection Data for this study was collected using a questionnaire as the main research instrument. The questionnaire was the most suitable instrument to use because the information required was brief. The research required standardized data and the questionnaire allowed respondents to quickly and easily understand the questions, which allowed for efficient data collection. A total of 100 respondents participated. Even though the questionnaire was in English, explanations of the questions were given in their native languages, whenevernecessary. To avoid the respondents losing interest and make them easily understandable, survey questions were formulated as brief as possible.
3.3 Sampling Strategy Participants were chosen on a random basis using simple random sampling method. The questionnaire was prepared and sent to the participants in an online form. The collected data was analysed and presented in form of graphs, charts and tables.
4. Results and Discussion
4.1 Demographics of Respondents A total of 100 respondents participated in the survey. This section of the questionnaire focused on gender, age group, education and employment status of family head and total number of employed members in family. This can be seen in the table given below:
| Demographic Variables | Categories | Frequency | Percentage |
| Residents | Patna | 100 | 100% |
| Gender | Male | 66 | 66% |
| Female | 34 | 34% | |
| Age Group | < 20 | 21 | 21% |
| 21 – 40 | 47 | 47% | |
| 41 – 60 | 24 | 24% | |
| > 60 | 8 | 8% | |
| Education | No formal schooling | 11 | 11% |
| School | 18 | 18% | |
| Intermediate/Graduate | 46 | 46% | |
| Masters | 18 | 18% | |
| Doctorate | 7 | 7% | |
| Employment status of family head | Unemployed | 7 | 7% |
| Daily Wage Worker | 6 | 6% | |
| Small/Street Vendor | 7 | 7% | |
| Public/Government | 25 | 25% | |
| Private | 29 | 29% | |
| Farmer | 4 | 4% | |
| Other | 22 | 22% | |
| Number of employed members in family | 0 | 4 | 4% |
| 1 | 29 | 29% | |
| 2 | 41 | 41% | |
| 3 or >3 | 26 | 26% |
4.1.1 Limitations of Sample Population It is important to acknowledge limitations relative to the demographics of the sample population. A key finding was that a larger proportion of the sample was male (66%). Hence the answers to the questions are more likely to be male dominated.
4.2 Awareness about COVID-19
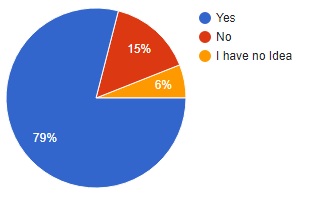
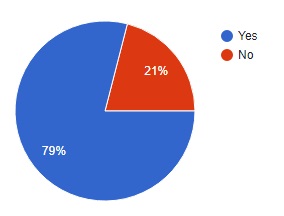
Through our study we came to know that a significant percentage of the respondents (79%) are aware of covid-19.
4.3 Mass Media Components that Generate Awareness
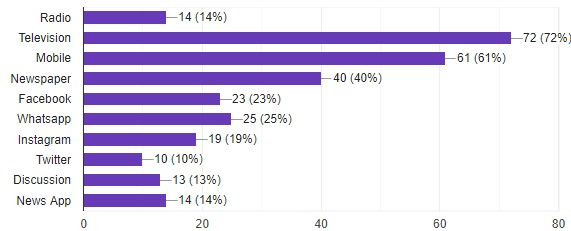
Our study shows that the components of media that more effectively generated awareness were television (72%) and mobile phones (61%). Social media applications such as facebook, whatsapp, instagram and twitter also accounted in generating awareness.
4.4 Knowledge about Forms of Pollution
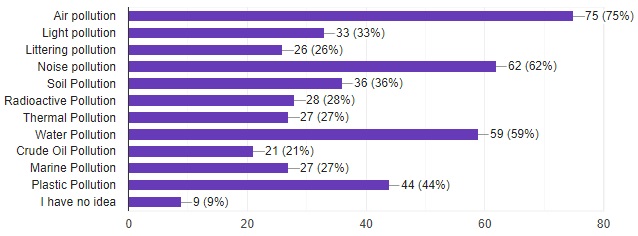
Through our study we get to know that people are more informed about air pollution (75%) than any other form of pollution. The air pollution is followed by noise pollution (62%) and water pollution (59%) in term of knowledge of the forms of pollution.
But we found that only a 44% of people are aware of plastic pollution. The government needs to take initiatives to keep the people well informed about plastic and its side effects.
4.5 Priority Concern about Waste in the Area
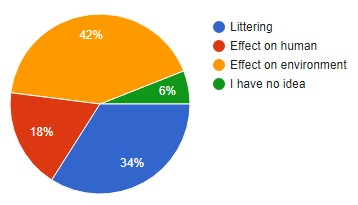
A large proportion of people think effect on environment (42%) is a priority concern about waste in their area followed by 34% of the people thinking littering is the priority concern.
We found that merely a small proportion of people (18%) think the waste has an effect on humans.
4.6 Practice any type of Recycling/Waste Segregation at Residence/Office
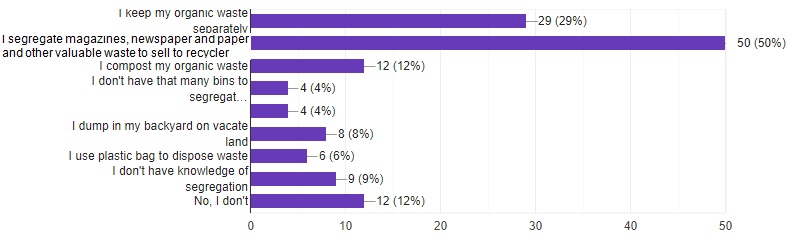
We found that 50% of the respondents were into segregating magazines, newspapers, papers and other valuable wastes to the local recycler. This needs to be taken care of as this percentage is very less than satisfactory.
To us this shows that the people are unaware of recycling and there stands a need to make them aware of recycling.
4.7 Burning Garbage
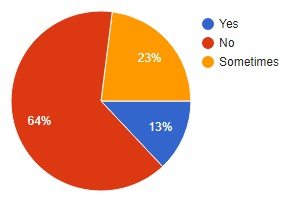
Through our study we get to know that 13% of the respondents burn their garbage and 23% of the respondents burn their garbage sometimes. This gives us a total of 36% of the people who still practice burning their garbage.
The burning of garbage is very harmful for the environment. This also results in air pollution.
4.8 Nearest Waste Collection Point
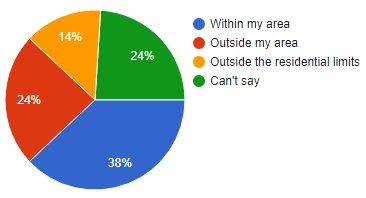
Looking at the data we can say that 38% of the respondents have waste collection point within their area but the figures that comes as a shock to us is that around 24% of the respondents are unaware of where their waste is collected. This accounts to around ¼ of the sample population unaware of where their waste is collected.
4.9 Why is plastic pollution harmful?

According to our study 62% of the respondents believe that plastic pollution is harmful for the environment followed by 52% who believe that it is harmful for human beings too.
4.10 Steps to Cut Down the use of Plastic
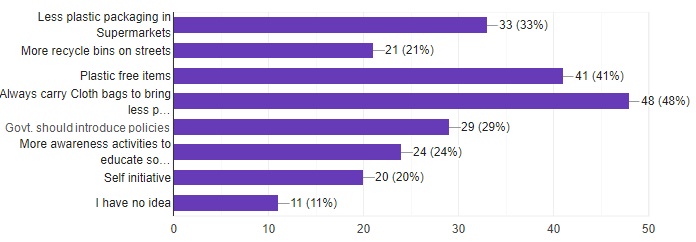
According to our study 48% of the respondents believe that there is a need to carry cloth bags to shops followed by 41% of the respondents who believe that there should be plastic free items.
Carrying cloth bag to the shops should be promoted as this will have a huge impact on the use of plastic bags.
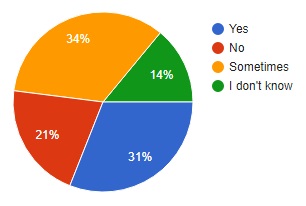
4.11 Separation of Dry and Wet Wastes
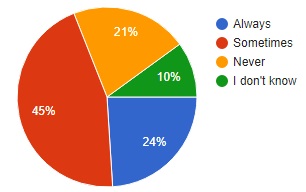
A good percentage of sample population (69%) practices separation of dry and wet wastes out of which 24% practice regular separation of dry and wet wastes and 45% sometimes separate their dry and wet wastes.
4.12 Frequency of Garbage Collection in Neighborhood

A good percentage of sample population (57%) garbage is collected four or more times a week followed by 18% of sample population whose garbage is collected at least twice a week.
4.13 Knowledge of Single Use Plastic
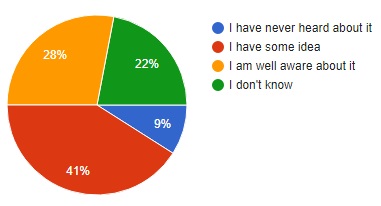
Looking at the data we can say that about 72% of the sample population have no idea about single use plastic, have never heard of it or have limited knowledge of single use plastic.
We can say that there is a need to educate people of the single use plastic and how much does it harm the environment.
4.14 Collection of Plastic Waste by Waste Collector
According to our study 46% of the sample population say that their waste is not collected separately in form of wet and dry wastes.
This results in the organic wastes to mix up with dry waste such as bottles, cans, clothing, plastic, wood, glass, metals and paper.
4.15 Dustbins Placed on Roads
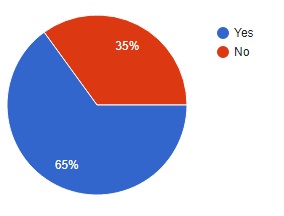
Looking at the data we can say that majority of the sample population (65%) feels that there are dustbins placed on roads.
4.16 Do Wastes Lye on Roads/ Float over Rivers
Looking at the data we can conclude that most of the respondents (79%) find wastes lying on roads and floating over rivers. Since there are dustbins placed on the roads this is irresponsible behavior that leads to accumulation of wastes on roads. There is a need to make people aware.
4.17 Awareness Regarding Characteristics of Plastic
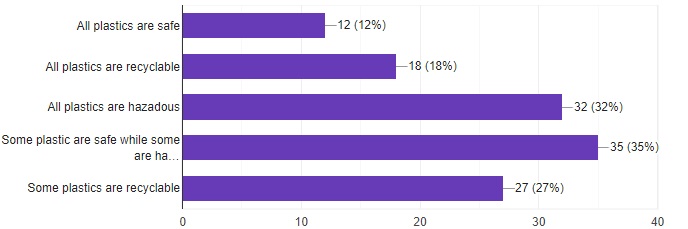
A good percentage of sample population (35%) believes that some plastics are safe while some are hazardous followed by 32% of the population believing that all plastics are hazardous.
4.18 What do Shops Nearby Use
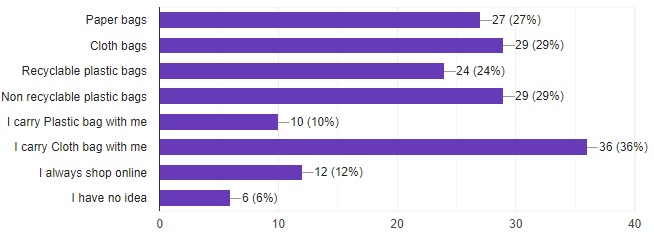
It is observed that a good percentage of sample population (46%) carry their own bags out of which 36% carry a cloth bag and 10% carry a plastic one. 29% say that cloth bag is used and 27% say paper bag is used.
4.19 Awareness Related to Fine Imposed on Use of Plastic Bag
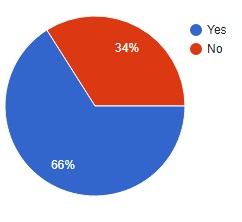
Around 66% of the sample population is aware of the fine imposed on use of plastic bag but 33% of the population is unaware of the same.
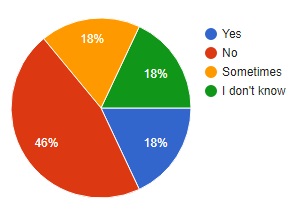
4.20 Landfill in Locality
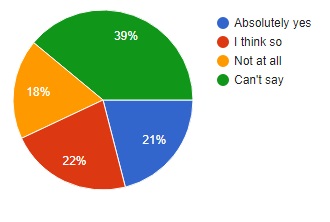
Looking at the data we can say that 21% of the respondents agreed for landfill in locality and 22% of respondents can think of it.
But the 18% who say not at all and 39% who cannot say anything need to be made aware what landfill means and the process of land filling.
4.21 Container for Waste Collection at Home
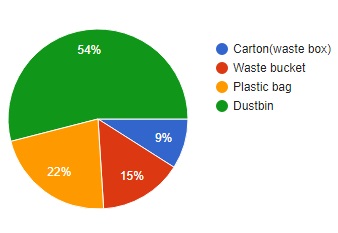
Looking at the data we can say that about 54% of the respondents collect their wastes in dustbin and 15% in waste bucket.
But still there are 22% of the respondents that account to about one-fifth of the sample population who still collect wastes in plastic bag.
4.22 Institutes Conducting Awareness Campaign
Around 65% of the respondents feel that there are campaigns conducted to generate awareness among the residents.
4.23 Opinion on Use of Single Use Plastic
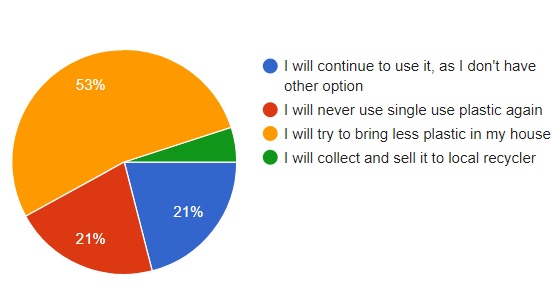
Looking at the data we can conclude that more than half of the respondents (53%) will try to bring less plastic in their homes and another 21% of the respondents will try to never use single use plastic again.
But we need to target the 21% of the population who will keep using plastic as they say they do not have any other alternative and educate them that that there is a need to stop using plastic and that there are alternatives.
4.24 Mode of Participation in the Survey
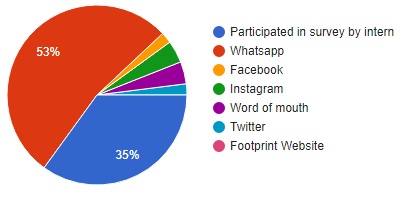
We get to see that the people participated through all modes but whatsapp (53%) was the most used mode of participation followed by participation by intern (35%).
5. Conclusion and Recommendation
This research found there to be on a neutral side. Recommendations are made in relation to the findings of the research. The recommendations are practical and might play role in reducing the use of single use plastic. We have found that high plastic consumption rates and improper waste handling has increased the amount of plastic pollution, with plastic litter becoming an eyesore in many places. We do have people who have good knowledge about single use plastic and its impacts and are trying to minimize its use as far as possible and on the other hand we too have people who are unaware of single use plastics and its impacts and will continue to use it as they do not have any alternate available. Strategies such as awareness generation among people to avoid using plastics and especially single use plastic as far as possible and educating them that used plastic should not be thrown here and there and should be properly treated and recycled.
The research also finds that there is regular waste collection but the dry and wet wastes are not collected separately and this results in the organic wastes to mix up with dry waste such as bottles, cans, clothing, plastic, wood, glass, metals and paper. The government is recommended to take necessary actions. The government should put more efforts to collect the used plastic and then to recycle it. The laws pertaining to ban on plastic bags have are certain flaws such as plastic bags without handles are permitted and that plastic bags above certain micron level can be used that make it easier for people to use these loopholes to freely use plastic. The law should be revised and stricter norms pertaining to ban on plastic should be introduced.
The research also finds that the most popular platforms to generate awareness and reach out people are social networking sites such as facebook, instagram, twitter etc. These platforms might play a role to reach out the people and generate awareness. Further television plays an important role in generating awareness among people. Furthermore radio is widely used and newspapers are also circulated in a mass. They can generate awareness to a mass. To conclude we must say that with all amazing technologies around the globe , we still are forced to use singe use plastic due to lack of a perfect alternative. So all we can do now is to generate awareness.